Tracking and analyzing your website traffic is one of the most important things you can do for your business. Without it, you're guessing. With it, you know exactly what's working, where your visitors are coming from, and what to fix.
In this guide, we'll walk you through how to analyze your web traffic using Google Analytics 4, Google Search Console, and a few other free tools — with a specific focus on what matters most for B2B businesses.
For B2B companies, website traffic isn't just a vanity metric. It's a signal. The right traffic - the right people, from the right sources, landing on the right pages - directly impacts how many leads you generate and how many of those convert into clients.
When you analyze your traffic properly, you can answer questions like:
Without this data, you're spending time and money creating content and building pages with no idea what's actually working.
Google Analytics 4 (GA4) is the current standard for web traffic analysis. If you're still on Universal Analytics, it has been discontinued - you need to migrate to GA4.
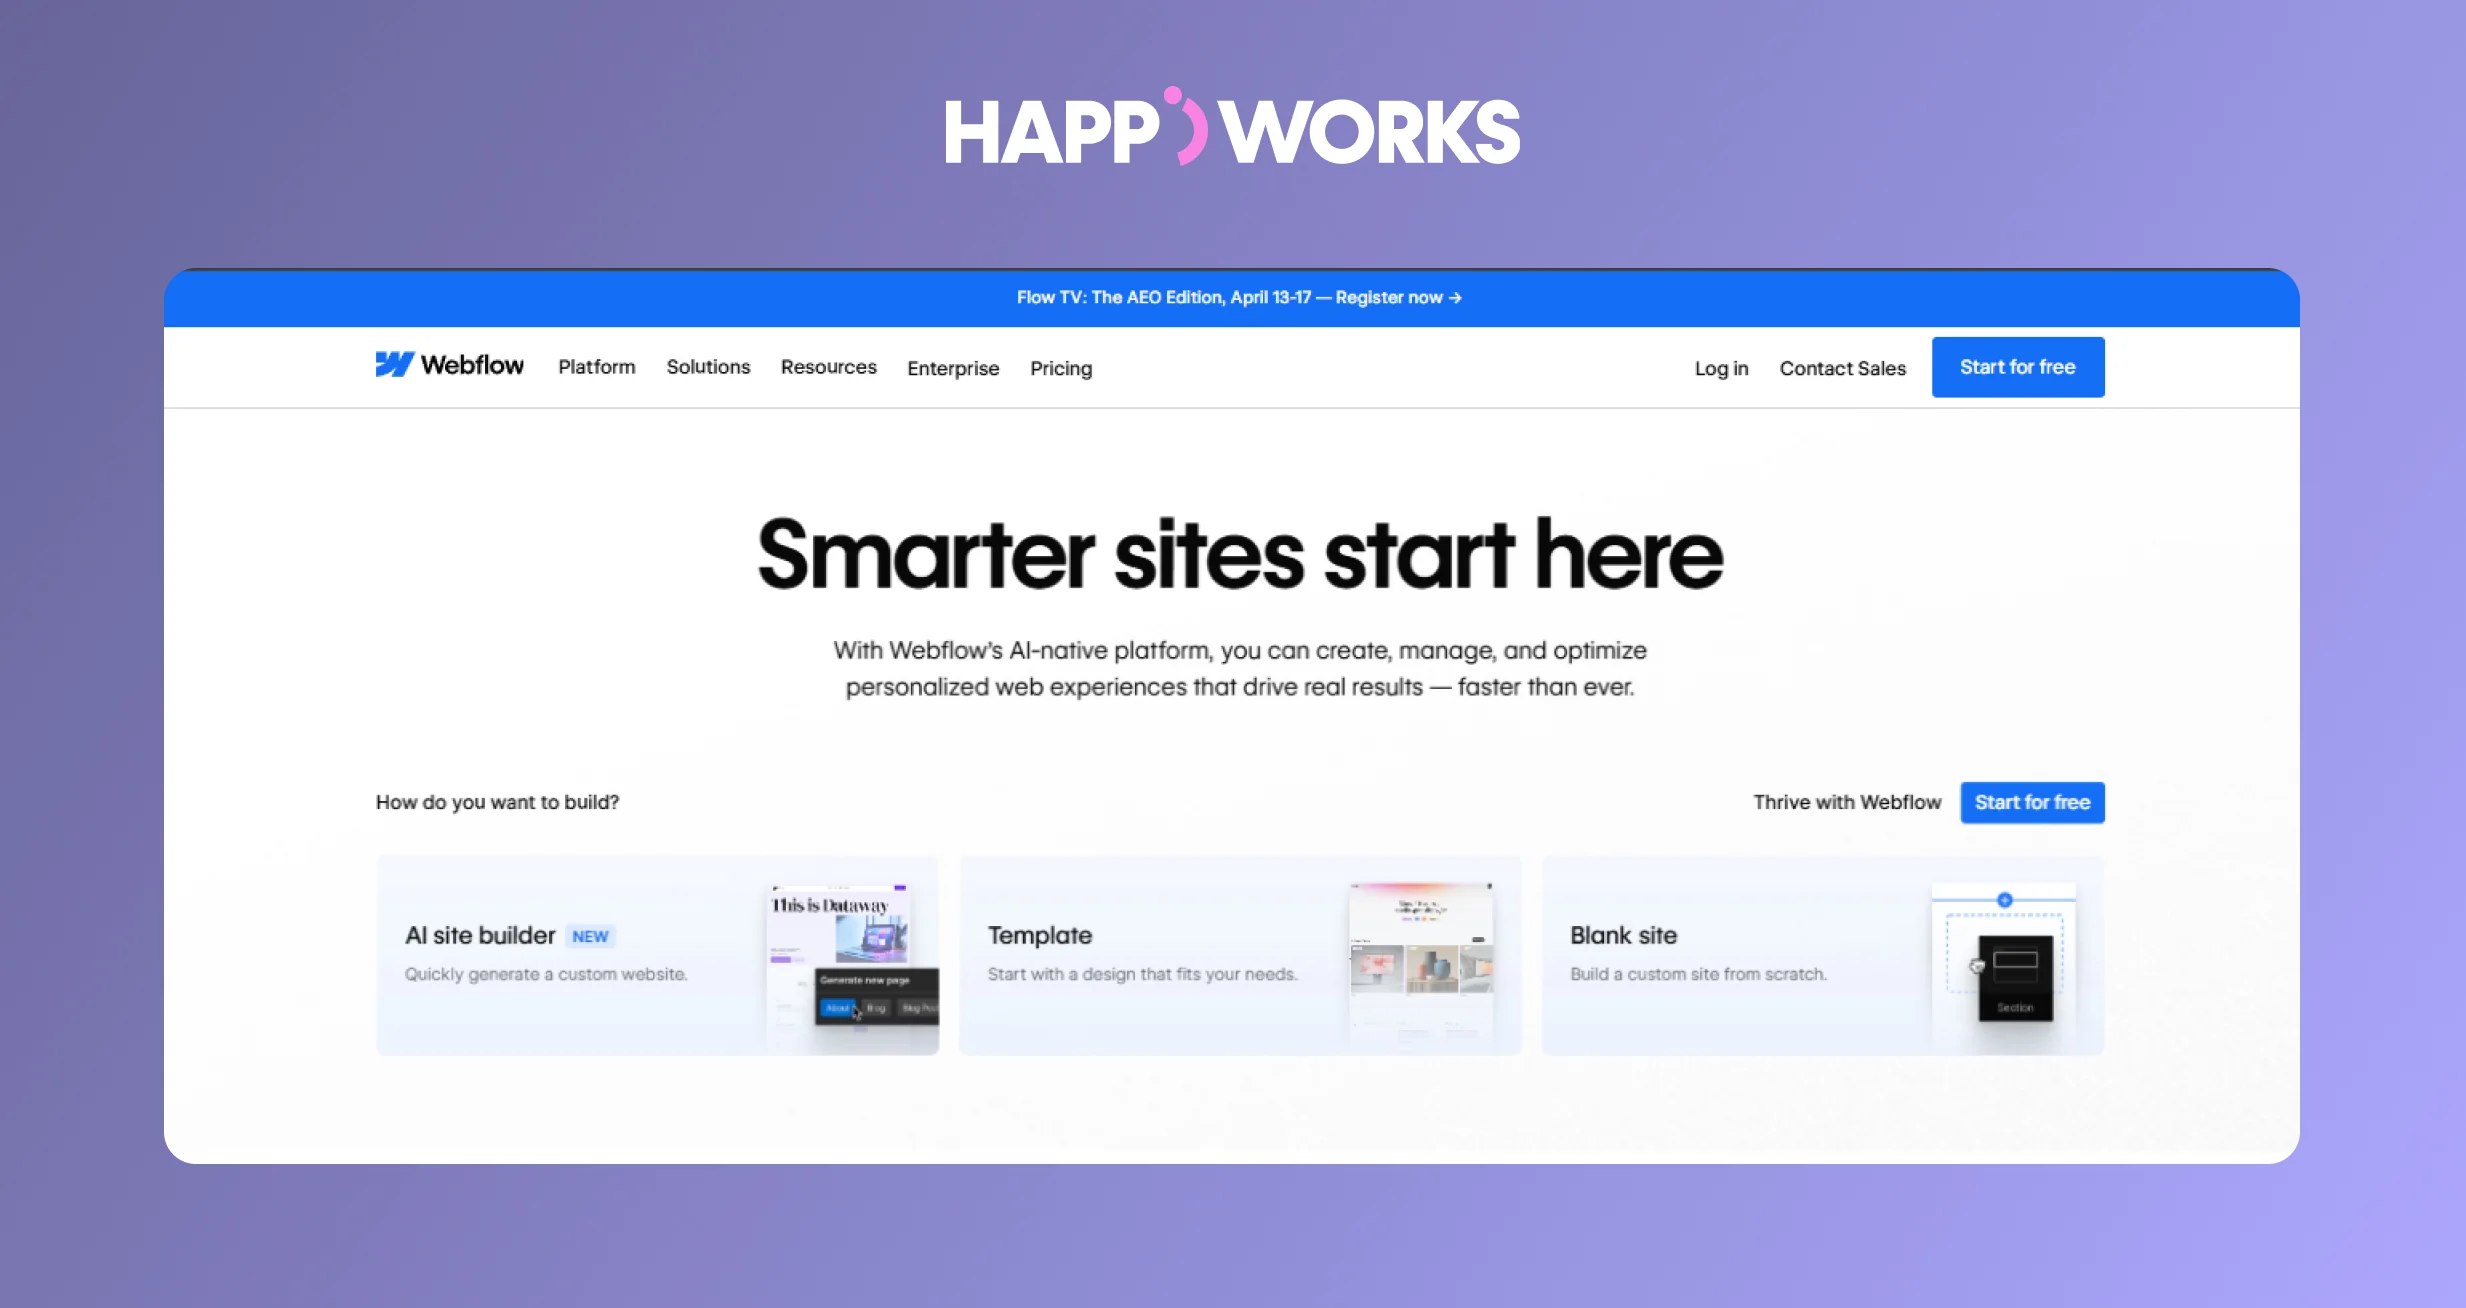
How to set it up on Webflow:
Once set up, GA4 will begin collecting data within 24–48 hours.
Once GA4 is live, here's what to focus on:
Found under Reports → Acquisition → Traffic Acquisition
This tells you where your visitors are coming from:
For most B2B businesses, Organic Search should be your goal. It's the most sustainable, highest-intent traffic source.
GA4 replaced "Bounce Rate" with Engagement Rate - the percentage of sessions where a user spent more than 10 seconds, viewed more than one page, or completed a conversion.
A good engagement rate for B2B is typically 50–70%.
Set up Conversion Events for the actions that matter most to your business - form submissions, contact page visits, or button clicks. Without this, you won't know if your traffic is actually generating leads.

One of the most important (and most overlooked) analyses is your mobile vs desktop traffic split.
In GA4, go to Reports → User → Tech → Platform/Device Category to see this breakdown.
Here's why it matters for B2B:
What to look for:
At Happiworks, we build Webflow sites that are fully optimized for both mobile and desktop — because in 2026, you can't afford to prioritize one over the other.
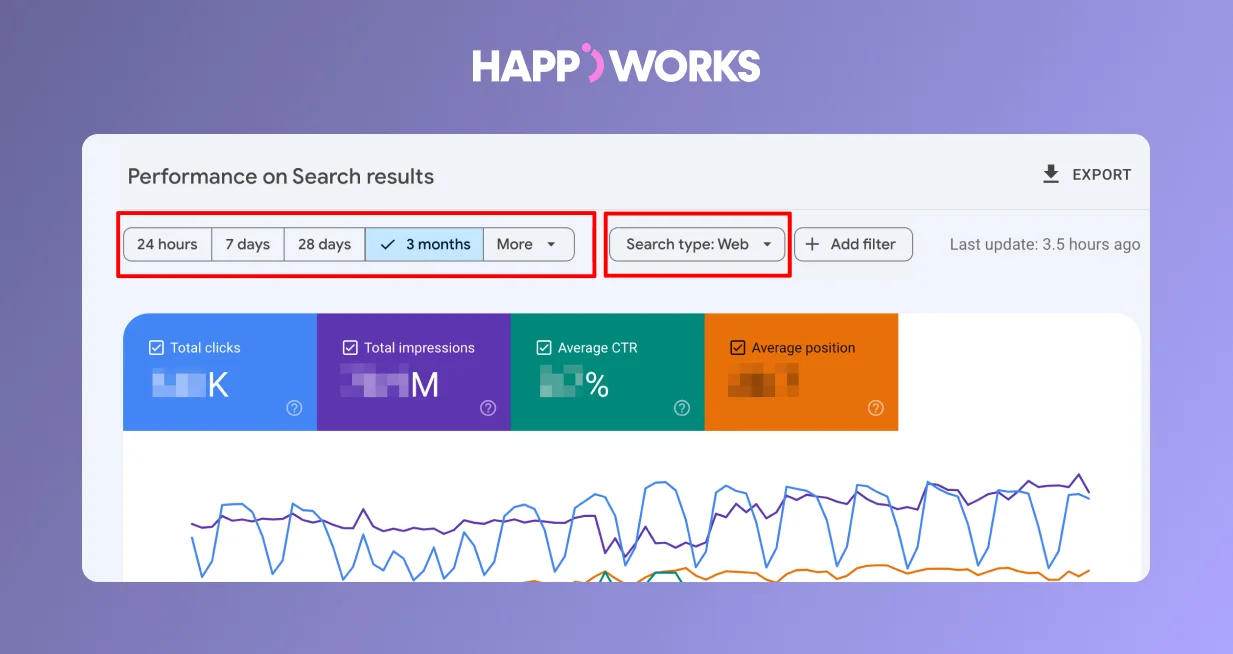
Google Search Console (GSC) is a free tool that shows you exactly how your site performs in Google Search. While GA4 shows you what happens after someone arrives on your site, GSC shows you what happens before - the keywords people searched, how often your site appeared, and how often they clicked.
How to set it up:
Key metrics in GSC:
Pro tip: Sort your queries by Impressions (high to low) with 0 clicks. These are your biggest opportunities - pages Google is already showing, but that aren't getting clicked. Fixing the title tags and meta descriptions on these pages can unlock traffic fast, with no new content needed.
Good for checking keyword rankings, estimating organic traffic, and doing basic competitor analysis. The free tier gives you limited daily searches but is enough for a quick health check.
Hotjar records user sessions and creates heatmaps showing where people click, scroll, and drop off. This is invaluable for understanding why people leave certain pages — which GA4 alone can't tell you.
If you're a B2B brand, LinkedIn is likely one of your key traffic sources. LinkedIn's native analytics show post reach, engagement, and follower demographics - useful for connecting social performance to website traffic in GA4.
Data is only useful if you act on it. We recommend setting aside 30 minutes at the end of each month to review:
Over time, this monthly habit will show you clear trends and tell you exactly where to focus your content and design efforts.
Message Us
Analyzing your web traffic doesn't have to be complicated. Start with GA4 and Google Search Console, understand where your visitors are coming from, check how mobile vs desktop performance compares, and look for pages with high impressions but low clicks - those are your fastest wins.
If you need help setting up GA4, interpreting your data, or improving the pages that aren't converting, that's exactly what we do at Happiworks.

Take a moment to explore our blogs and stay updated on the latest design trends, SEO strategies, and development insights. Whether you're a creative professional or a tech enthusiast, there's something for everyone!